The Drilling tab of the Cyberloop EDR application allows users to monitor drilling processes. The main part of the Drilling tab contains charts and drilling parameters such as Rig Activity, Bit Depth, Hole Depth traces by default. The traces of other charts are adjusted by the user.
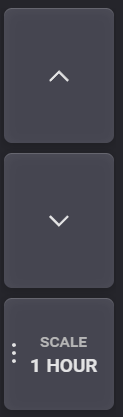
On the right panel are placed scaling, scrolling, and mode buttons. Selected range can be shifted by arrow controls. Single arrow control shifts the range to currently selected range Up or Down.
Click on Scale button opens modal window with available scaling steps. Scale of the selected range for the TIME mode with following steps:
5min - 10 min - 15 min - 30 min - 1 hour - 2 hour - 4 hour - 6 hour - 12 hour - 24 hour - 48 hour.
If selected time range falls between two zoom steps click on the zoom button zooms to the next step.
Scale of the selected range for the DEPTH mode with following steps:
10m - 20m - 50m - 100m - 200m.
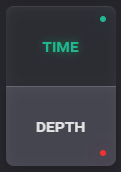
The drilling parameters can be monitored in Depth mode or Time mode. If the Depth mode is selected the charts are plotted depending on the hole depth. If the Time mode is selected the charts are plotted depending on the time.
To switch to one of the two modes, click on the corresponding button on the right panel. When the monitoring mode is switched on selected the button is highlighted with green color.
The representation of the charts gets updated in real-time if the Live mode is turned on. To turn it on click on the Live button so it is highlighted with green color. When the Live mode is tuned on, the selected range will be reset to the live values.
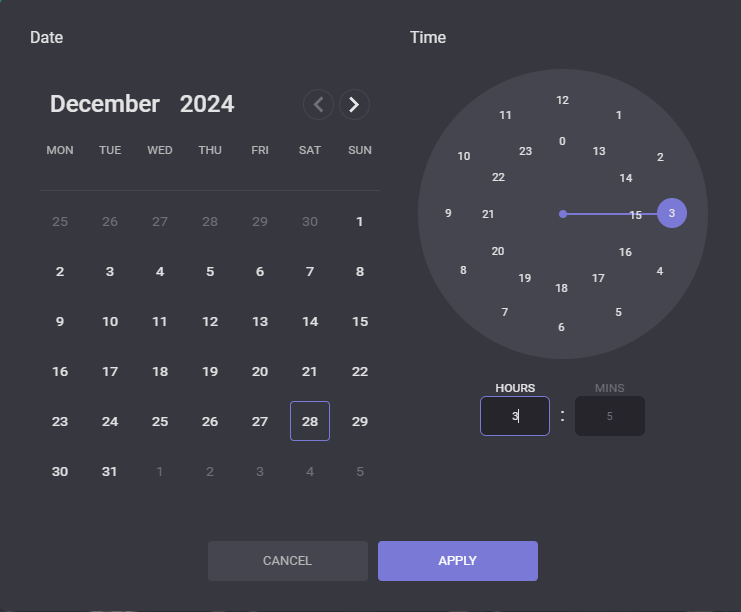
The range can be defined manually on the RIGSTATE chart by dragging the Slider controls and moving selected range by the chart. For the Time mode click on the Start/End date of the range selector expands date and time picker to define date and time manually.
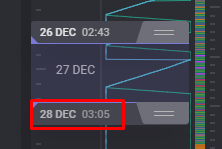
In the opened modal window select date and time to define Start/End of the range to be displayed on the charts. On click on Apply button in the date picker dialog the range will be updated.
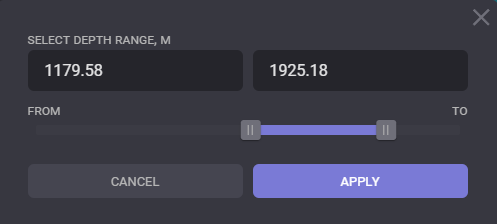
For the Depth mode click on From/To of the range selector expands depth selector to define depth manually.
To add parameters to track on the charts click on the Add trace button at the bottom of the chart area. On one chart can be added three parameters.
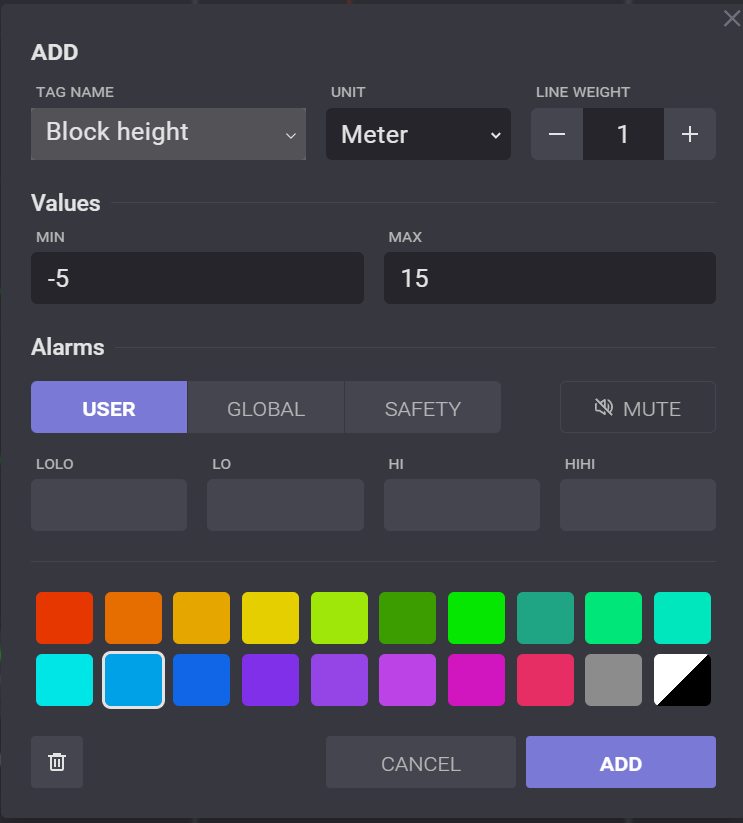
In the opened modal window click on the Select trace field to select parameter to trace on the chart. The range of the parameter can be adjusted by specifying minimum and maximum values for the trace. The graphic for the parameter will be aligned according to entered values. The color of the plotted graphic can be picked in the Select the trace color block. The desired color can be specified on the color pickers or by entering the color number.
In the Alarms block the values to trigger alarms are displayed. There are four values that can be specified:
-
Alarm LoLo - if the parameter is lower than this value its legend will be highlighted with red color on the chart;
-
Alarm Lo - if the parameter is lower than this value its legend will be highlighted with yellow color on the chart;
-
Alarm HiHi - if the parameter is higher than this value its legend will be highlighted with red color on the chart;
-
Alarm Hi - if the parameter is higher than this value its legend will be highlighted with yellow color on the chart.
Alarms got set in the Configuration tab.
To see parameter value at the specific moment or a certain depth hover the mouse on the graphic and a pop-up window with corresponding values will appear.
The parameter can be deleted from the chart by clicking on the X-button of the corresponding parameters' key.
Creating, editing, deleting the workspace
To create a new workspace select the Mode that will be used to track the drilling process. Then click on the Display button on the right panel.
In the opened Display dialog click on the Add New and enter the name of new workspace and click on Apply in the New Workspace dialog.
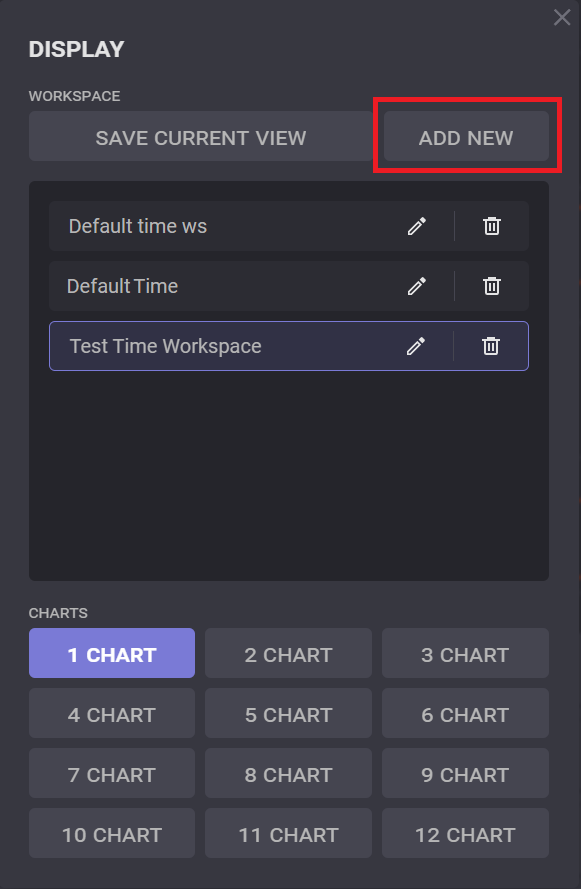
By default, new workspace got created with one chart. The number of charts for the workspace can be selected in the Display dialog.
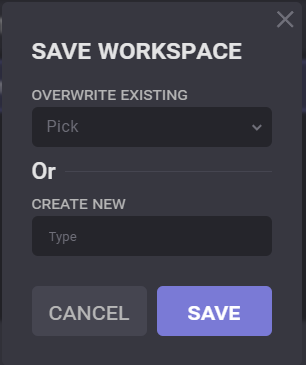
To save settings of current workspace and reuse it later, click on Save Current View button in the Display dialog. There are two options to save display: to update an already existing one or to create new. To update existing workspace click on “Overwrite Existing” field in the Save Workspace modal window and select workspace from the drop-down menu.
To create new workspace type name of the new workspace in the “Create New“ field and click on Save button.
Display Notes
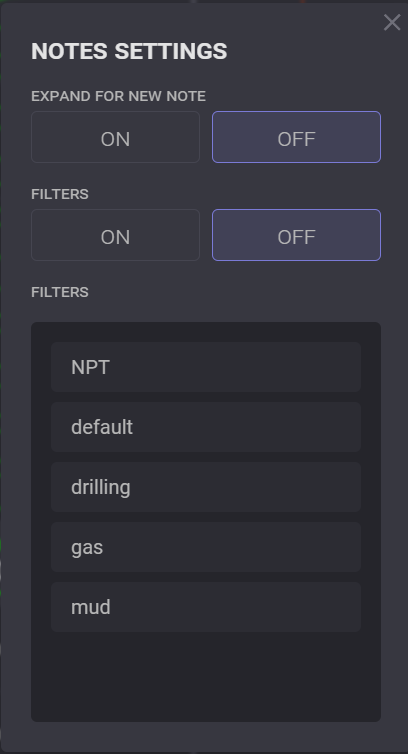
On the Rig activity chart displayed Notes created by users or by system. Click on the Notes icon expands the panel with notes. Displayed notes on the panel corresponds to selected time or depth range.

The displaying notes can be filtered by category in the Notes settings. Click on the Gear icon expands the Notes Settings dialog. In the Notes settings turn ON the filters to apply on the notes list that will be displayed on the chart.