The Cyberloop application delves into the intricacies of torque and drag analysis in drilling operations, providing essential insights to optimize well bore integrity and drilling performance. This dedicated page offers a wealth of data-driven information, innovative methodologies, and best practices to mitigate challenges and enhance drilling efficiency. From calculating torque and drag forces to understand their impact on drilling dynamics.
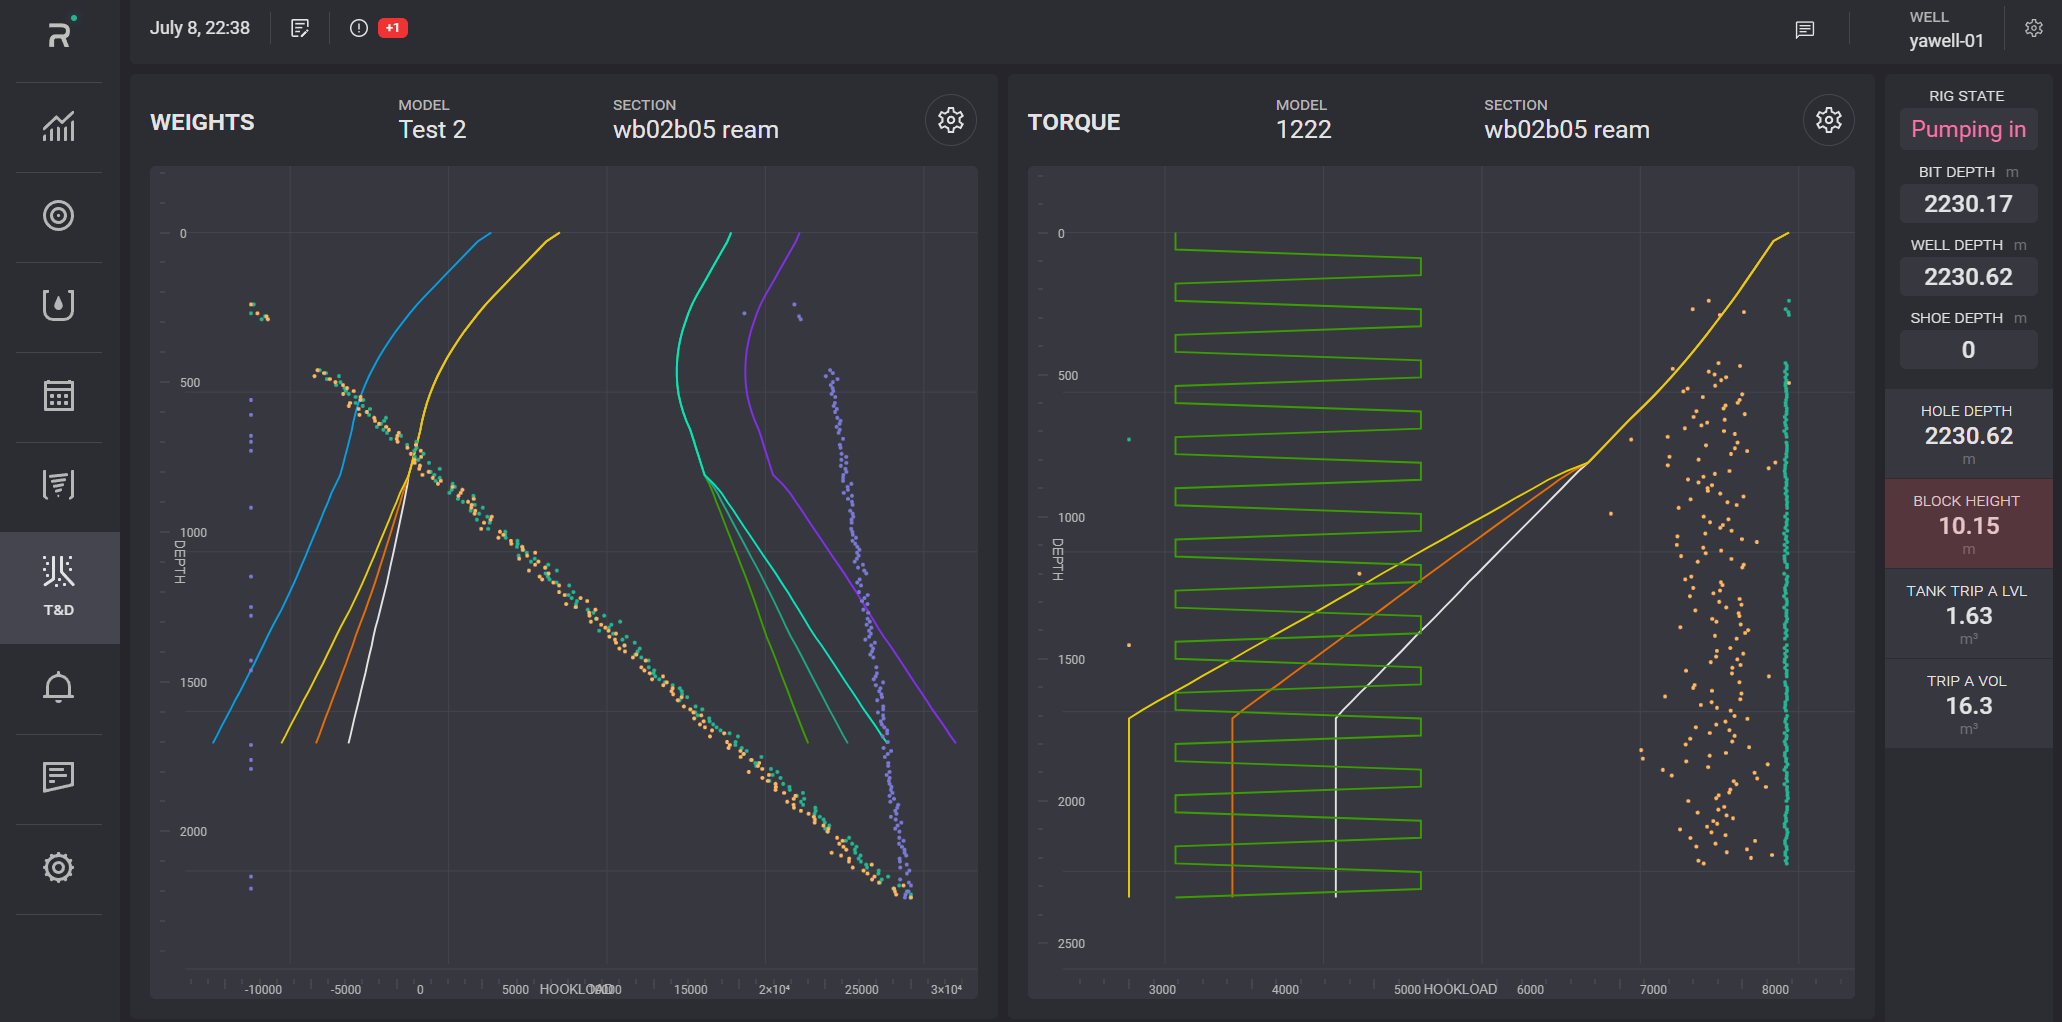
The Torque and Drag charts display the graphics for Weights and Torque.
On the Weight chart, the dependencies of the hook load (kg) on depth (m) are plotted. On the Torque chart, the dependencies of torque (Nm) on Depth (m) are plotted.
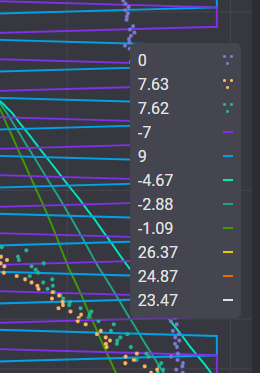
Plotted parameters and its chart color are defined in the legend on the right side of the chart. Exact values of the specific plotted point are presented in the tooltip displayed on hovering on it on the chart.
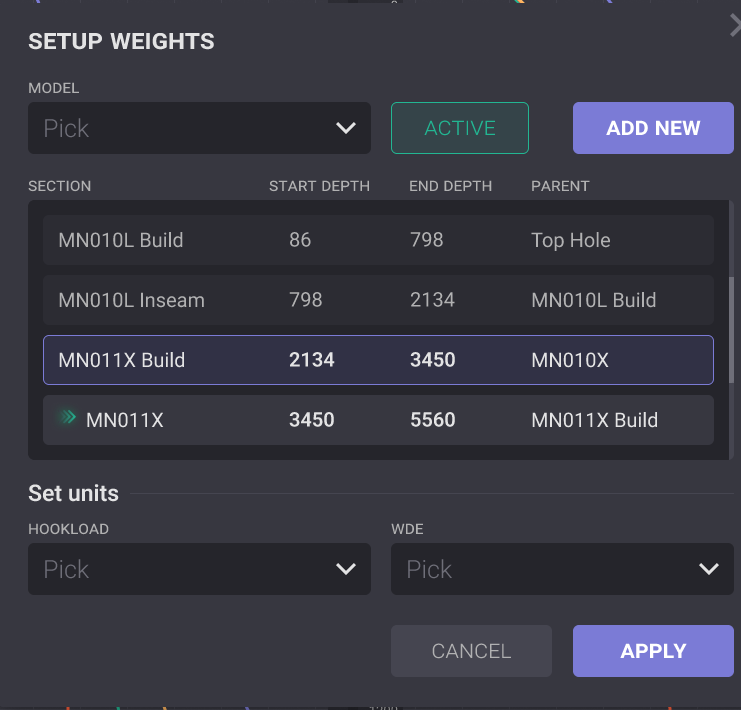
Click on the gear button on the top of the Weights or Torque plot opens its settings modal window, allowing you to change the measurement units to display on the graph or select another section. The section highlighted with a purple frame is the currently selected section. To change it, click on the section in the list and click the Apply button in the Setup dialog to display the plot for it.
To change units of the graph, select necessary units from the drop-down list for one or both axis and click on the Apply button. The graph will be re-plotted after closing the modal window.
The model of the charts can be added on the graph. On the top panel of the graph, click on the Add new button in the settings dialog. In the opened New Model window, click on the Pick file button to upload the .csv file with new model parameters.
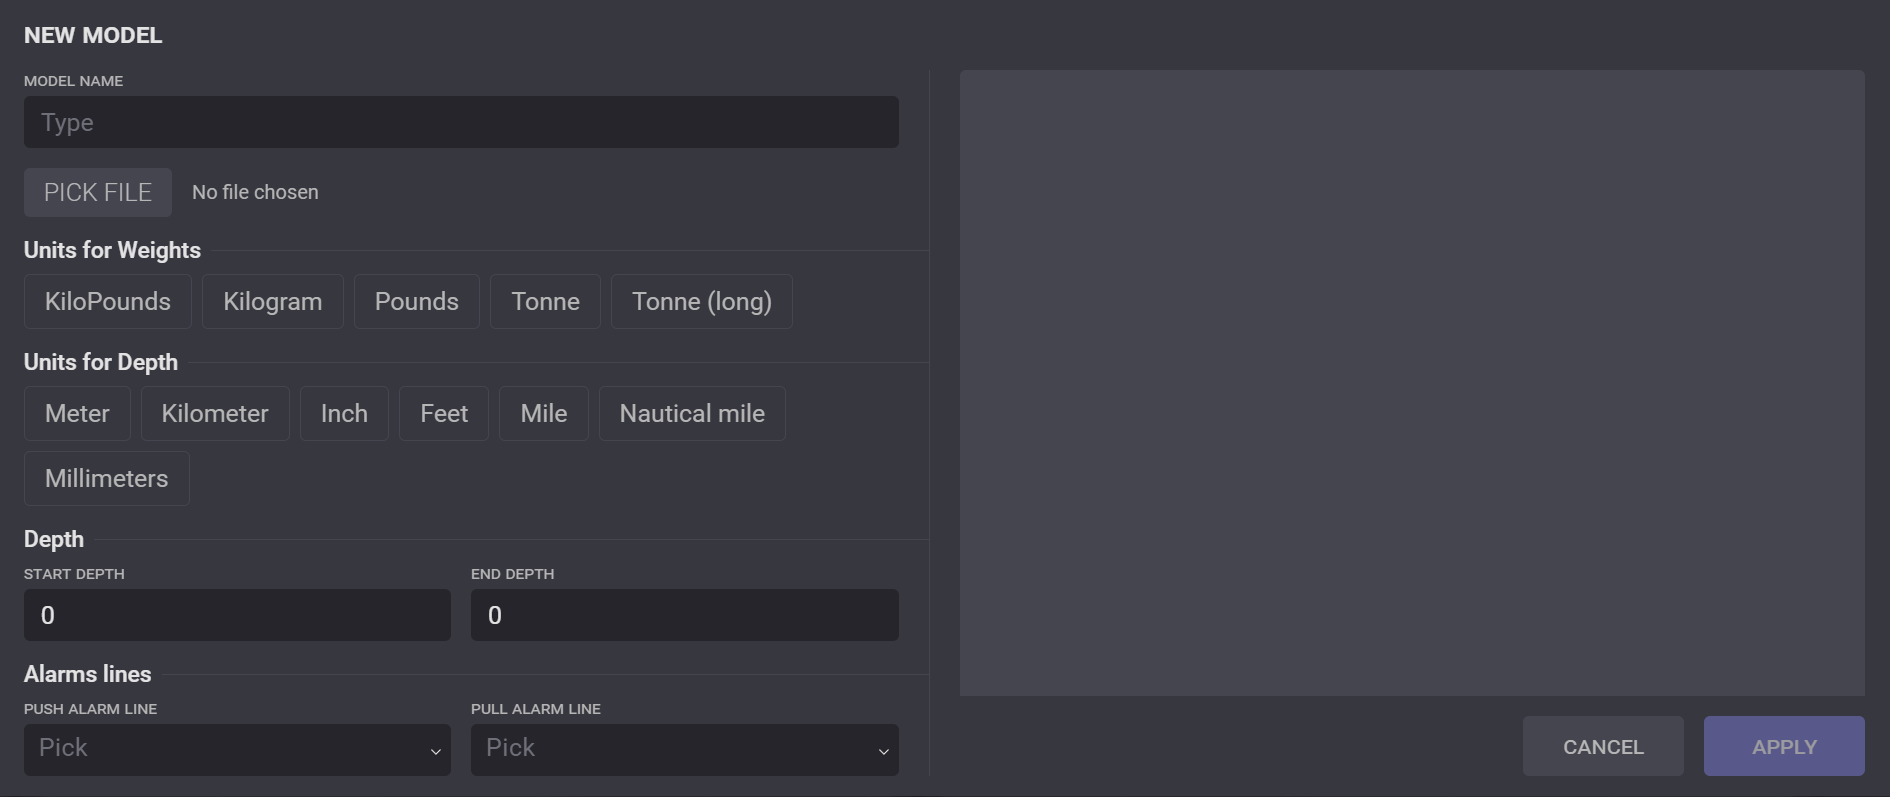
The model from the selected file will be pre-plotted in the chart area.
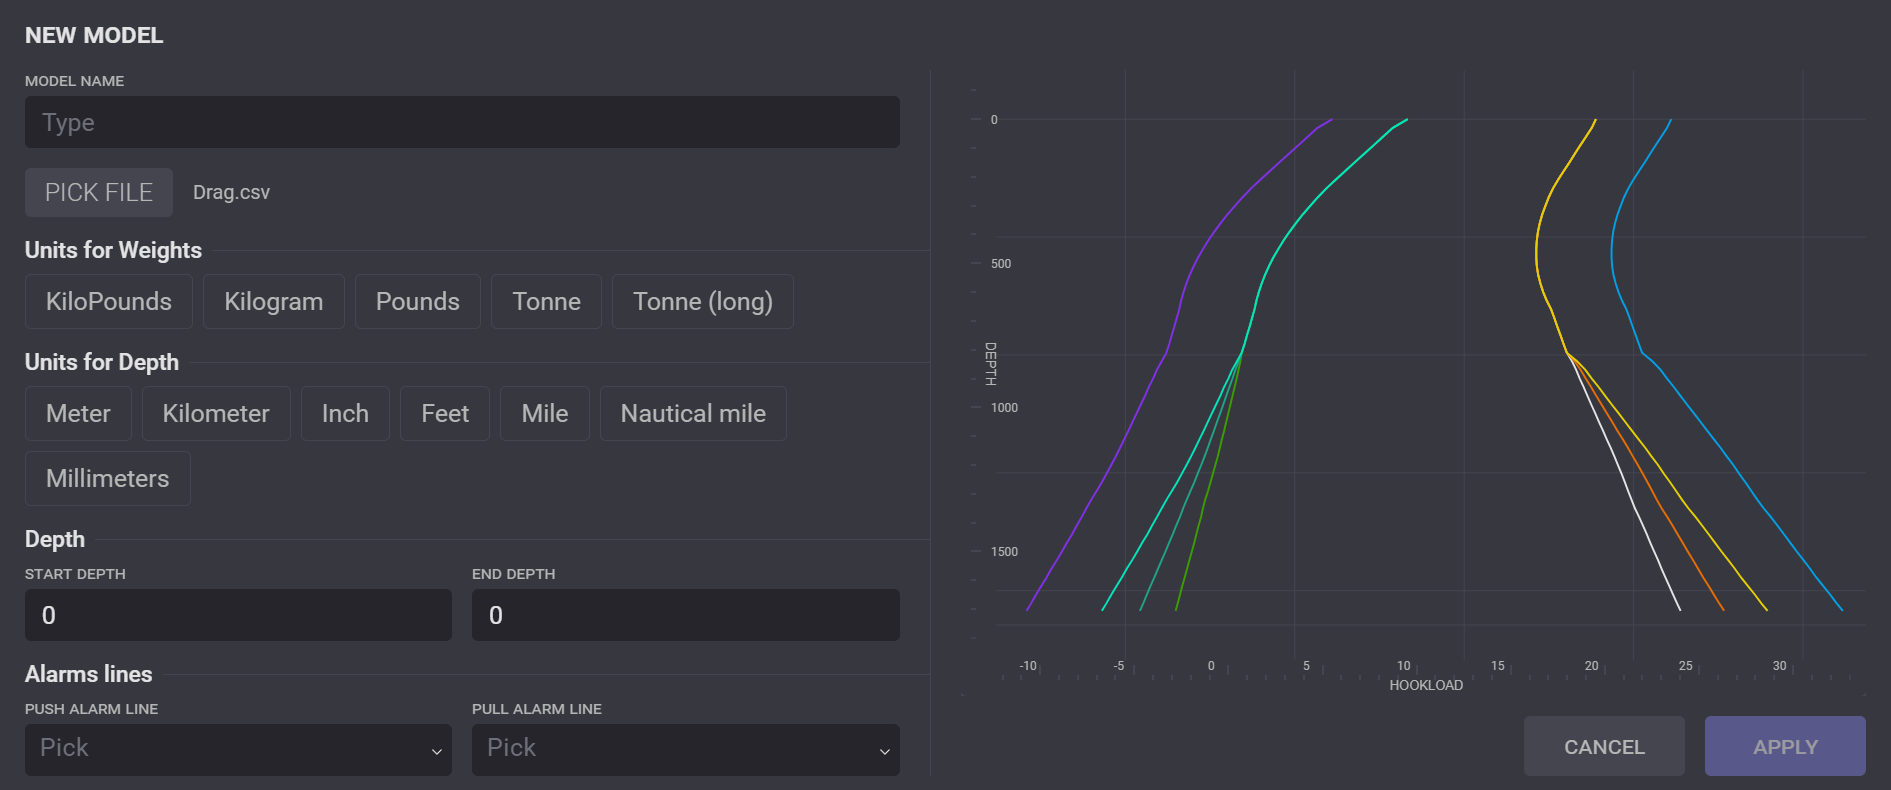
After uploading the file, entering the model name, and selecting units for the model, click on Apply to add the model to the list. To use a model on the plot, click on the Model field in the Setup dialog, select it from the drop-down list, and click on the Activate button. The selected model will be displayed on the chart after clicking on Apply in the Setup dialog.
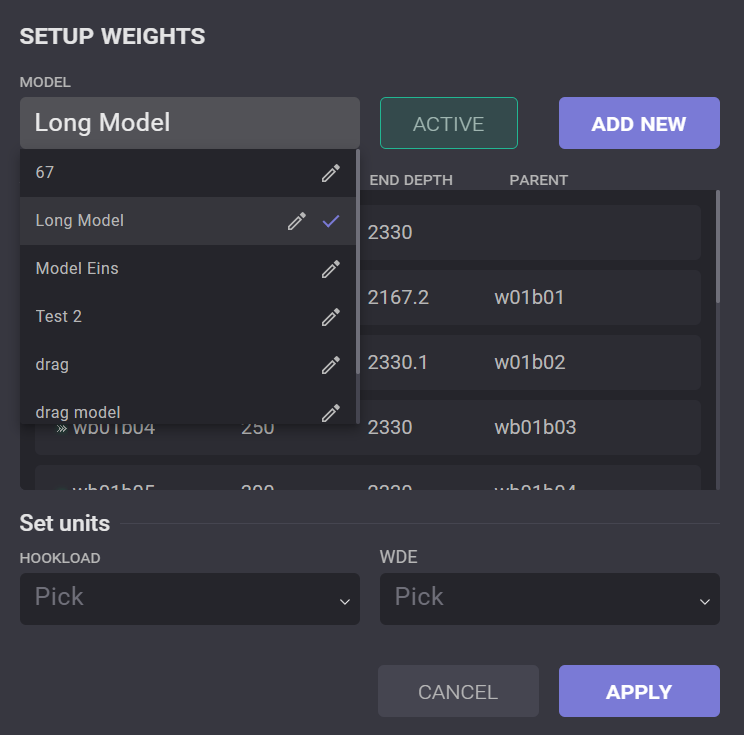
The uploaded model can be edited by clicking on the pencil icon next to it. In the opened dialog settings of the model can be changed or removed by clicking on the delete icon ![]()